Receive logs from bare-metal IOT Devices 📡
- Timo Lang

- 4. Feb. 2025
- 4 Min. Lesezeit
Aktualisiert: 13. Mai 2025
I recently supported an IoT startup in transforming their Arduino prototype into a stable, industrial-grade product (written in Rust ❤).
One of the key challenges was: How can we monitor our devices in production?
Given that the startup would continue rolling out new features at a fast pace, good monitoring was critical.
In this post, I’ll walk you through the solution we implemented to successfully monitor over 2,000 devices.
1. Collecting Logs on an Embedded Device 📥
You’ve likely used printf or a logger framework to output logs to a UART console for debugging an embedded target. While this can be practical during development, production environments rarely have a serial cable connected when critical logs are printed. As a result, you need to either stream logs to the backend in real time or store them on the device and retrieve them later.
In our case, streaming logs was not an option. The device was battery-powered and connected to the cloud infrequently to conserve energy.
Deferred Formatting for Efficient Log Storage
Storing logs in the device’s flash memory can be slow and space-consuming. However, by using deferred formatting to compress logs, it becomes feasible. Deferred formatting logs messages in a compact binary format by encoding arguments in their native forms and referencing strings via an ELF-based dictionary created at build time. This requires an offline parser to reconstruct human-readable messages.
For example, a log statement like LOG("Hyperdrive %d set to %f", drive_num, drive_value) would typically output a formatted string (>22 bytes). With deferred formatting, only a 2-byte ID for the format string and binary-formatted arguments (about 10 bytes) are output.
Frameworks for Deferred Logging
Several frameworks help implement this approach:
defmt for Rust
pw_log_tokenized from Pigweed for C++
Dictionary-based logging in Zephyr for C
We had a bare-metal Rust project targeting an ESP32, so we used defmt for deferred formatting. Since writing to flash is slow, we buffered logs and only wrote them when the MCU was idle. Our setup involved:
Creating a defmt #[global_logger] to write compressed logs to a bbqueue, a thread-safe, lock-free single-producer single-consumer queue.
Running an Embassy task to drain the queue and write logs to flash using sequential-storage for wear leveling and data integrity.
Logs were written to a separate partition (Espressif’s terminology for a specific flash region). When the partition was full, older logs were overwritten.
Command-Line Tool for Reading Logs
I developed a command-line tool to read logs from the device using probe-rs (a superior alternative to OpenOCD/GDB).While doing so, I noticed that we also need to store some metadata alongside the logs:
Firmware version (Git version and partition checksum): Required to select the correct ELF file for decoding messages. This becomes crucial when analyzing returned devices from customers.
Boot/Reboot markers: Useful for detecting crashes and locating relevant logs.
The tool had two modes:
1️⃣ Overview mode: Displayed available logs and firmware versions from a connected device:
 cfw logs dump
+----+----------------------------+------------------------------------------------------------------+------------+-----------+---------------------------------+
| ID | Firmware Version           | Partition Checksum                                               | Boot Count | Log Count | Max Timestamp                   |
+----+----------------------------+------------------------------------------------------------------+------------+-----------+---------------------------------+
| 0  | v0.3.0                     | E93D61AA1815D946F8AF036F6417825A104C71CEB1693526AFFA636CA50CB0B6 | 7          | 502       | 2024-09-12 11:39:22.0 +00:00:00 |
+----+----------------------------+------------------------------------------------------------------+------------+-----------+---------------------------------+
| 1  | v0.3.1                     | CE35EFAF5672EACC184609C086D65598A5963F704C65A40DDEF6119FECF500DC | 10         | 1266      | 2024-09-20 8:34:51.0 +00:00:00  |
+----+----------------------------+------------------------------------------------------------------+------------+-----------+---------------------------------+
| 2  | v1.0.0-modified            | 3E32ABBAE0DAA353D093A427F1C56A08335992A8BC71EFED7CE4ADDC0D3D3AEA | 3          | 58        | 2024-09-24 8:43:35.0 +00:00:00  |
+----+----------------------------+------------------------------------------------------------------+------------+-----------+---------------------------------+
2️⃣ Dump mode: Decoded and displayed logs of a specific batch (with file/line/module infos if needed):
cfw dump --index 1 --with-elf releases/v0_3_1.elf
1726726532000 INFO  Device initialized successfully.
1726726630000 WARN  Battery level low: 15%
1726726725000 ERROR Failed to connect to Wi-Fi network 'IoT_Network'. Error code: 404
1726726812000 DEBUG Sensor reading: temp = 23.4, humidity = 45.7
1726726925000 INFO  Hyperdrive mode set to warp, speed: 1234.5 km/h
1726726989000 TRACE Button press detected
1726727114000 ERROR Memory allocation failed: requested 512 bytes
1726727221000 WARN  Temperature approaching critical level: 95°C
2. Transferring Logs Over the Air and Decoding On the Fly 🔁
Storing logs in flash helps analyze returned products, but what about monitoring deployed devices?
Since deferred logs are smaller, sending them to the cloud becomes feasible. However, streaming all logs would drain the battery.We opted for the following:
Store logs above the trace level (Debug, Info, Warn, Error) in flash.
Send logs to the cloud only upon request.
Allow filtering logs by level and timestamp.
While timestamp filtering is possible with defmt out of the box, filtering by log level required a small modification on defmt’s internas.
Cloud Workflow
Developers upload ELF files to an S3 bucket, using the partition checksum as the object key.
Developers create a “Request Logs” job on AWS, specifying timestamp and/or log level filters.
The device receives the job upon connecting to the server.
The device iterates the flash and sends logs in batches to AWS IoT Core.
AWS IoT Core forwards logs to an AWS Lambda function.
The Lambda function fetches the corresponding ELF file from S3 and decodes the logs.
The decoded logs are stored in AWS CloudWatch.
Developers analyze and post-process logs in AWS CloudWatch.
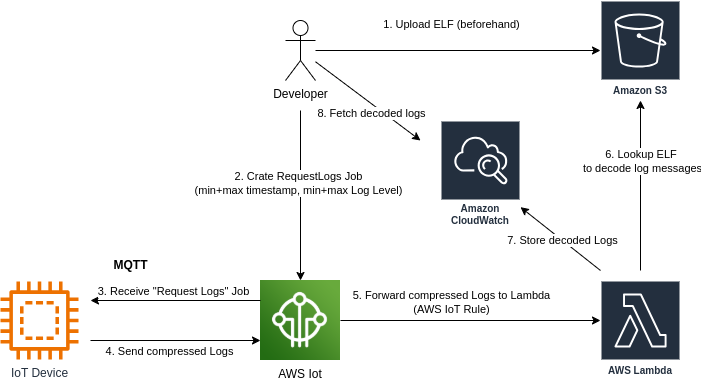
Diagram showing how Device, AWS and the develop interact
Daily Use
Monitoring errors:
Periodic cluster-wide jobs fetched error-level logs, which were aggregated in AWS CloudWatch.
Backend developers or customer support flagged issues.
Detailed analysis: We selected devices and time ranges for further investigation, retrieving logs at Info or Debug levels if needed.
Field returns: If connectivity failed or service technicians replaced devices on-site, returned devices were analyzed with the developed tooling. Metadata, such as firmware versions, proved invaluable.
Conclusion 💡
Reliable log storage and retrieval are essential for successful IoT products.
I’m happy to share my knowledge or open-source parts of the tooling I built. I’d also love to hear your feedback or comments. Feel free to say hi: info (at) lang-engineering.ch.


Kommentare